ASM: fortress balance sheet, La Preciosa loading — Pass #29

ASM: fortress balance sheet, La Preciosa loading — Pass #29

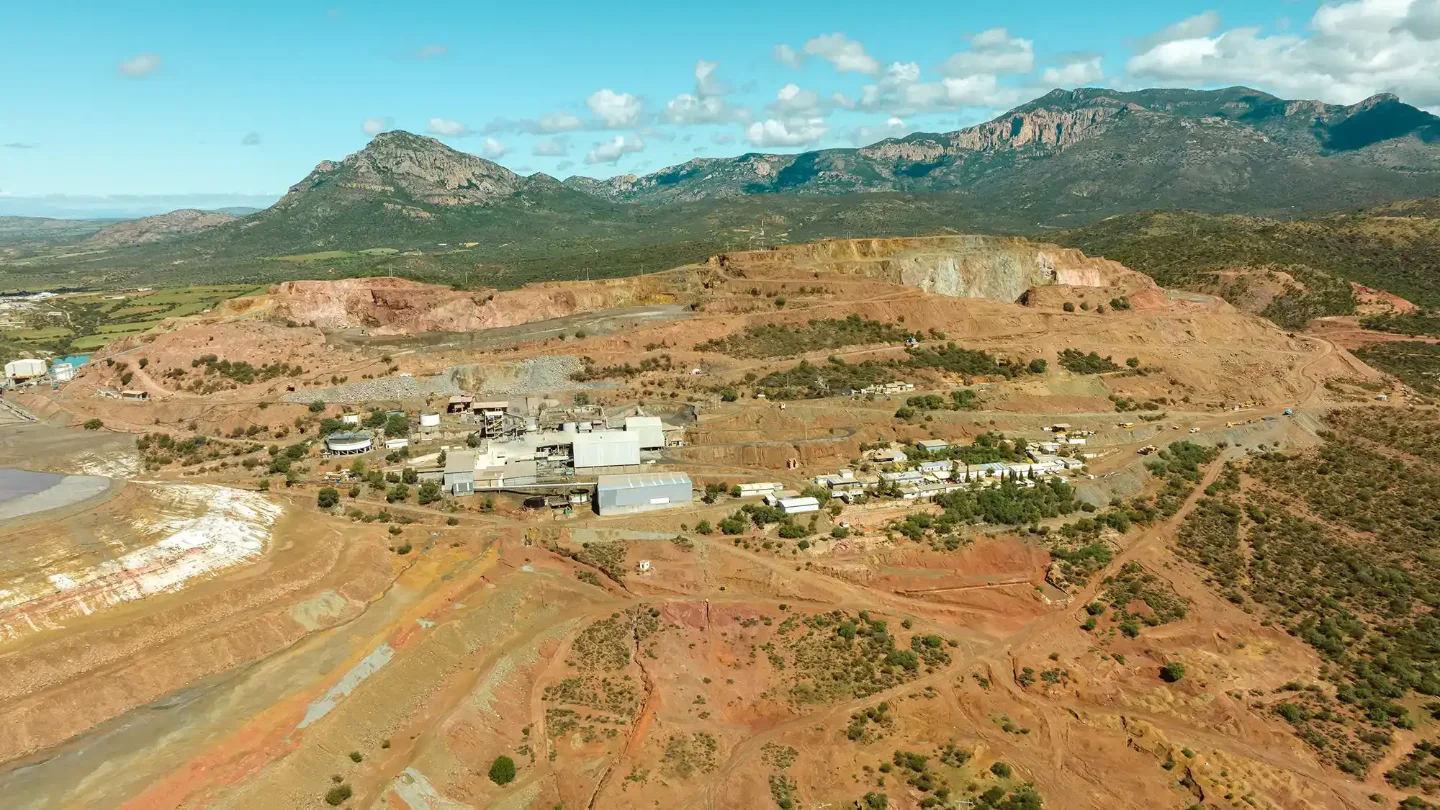
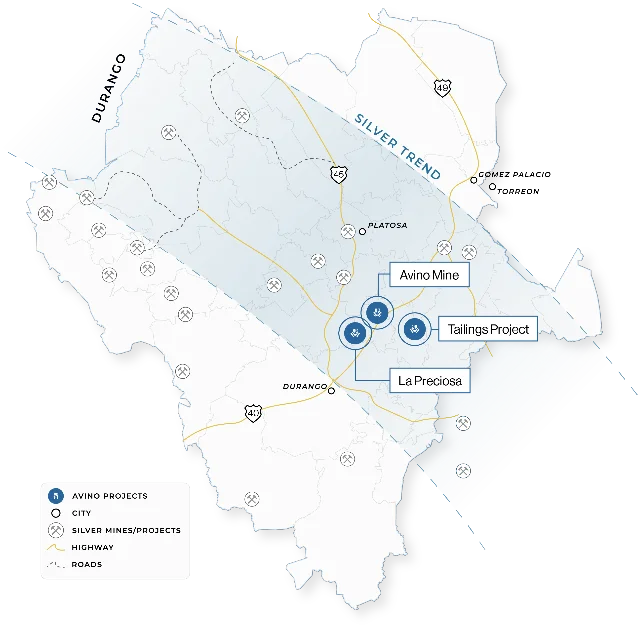
Avino Silver & Gold Mines (NYSE American: ASM) clears all four hard filters with dual-source confirmation — market cap $1.10–$1.15B, TTM revenue +55.36%, forward PEG 0.31 / trailing PEG 0.82, and OCF +$40.30M TTM. The article covers the three-asset Durango, Mexico portfolio (Avino Mine producing, La Preciosa ramping to 500 tpd in H2 2026, Oxide Tailings at pre-feasibility), a $130M net cash fortress balance sheet with Altman Z-Score of 11.99–14.71, eight consecutive quarters of YoY revenue growth, peer valuation context vs. HL/PAAS/CDE, five growth catalysts including the La Preciosa ramp and the June 2026 SVP Corporate Development hire (ex-MAG Silver), five key risks led by silver price sensitivity (5-year beta 2.89) and ongoing ATM dilution, and a Q2 2026 production report (late July) as the primary near-term catalyst.

Small-Cap Growth Pick: Revenue +30%, PEG < 1
June 20, 2026 · 9:25 PM
1 subscriptions · 32 items
Avino Silver & Gold Mines Ltd (NYSE American: ASM) — Pass #29 in the daily small-cap screen. ASM is the first Basic Materials / silver mining pick since AG (First Majestic, Pass #21) four issues ago. What sets it apart from that earlier pick — and from most silver miners — is what you do not find on the balance sheet: financial debt. Net cash of $130M against $8.3M in total liabilities, an Altman Z-Score of 11.99–14.71 across two independent sources, and a second mine (La Preciosa) targeting commercial-scale production in H2 2026. All four hard filters pass with dual-source confirmation.

Hard filter scorecard

FilterThresholdActualSourcesVerdict
Market cap< $10B$1.10–$1.15BStockAnalysis, Yahoo Finance, Finviz✅ Pass
TTM revenue growth> 30%55.36%StockAnalysis (55.36%), Finviz (58.64%)✅ Pass
PEG ratio< 1.00.31 (forward) / 0.82 (trailing)Finviz (only source providing PEG; StockAnalysis / Yahoo show n/a per mining convention)✅ Pass
Operating cash flowPositive+$40.30M TTMStockAnalysis, Yahoo Finance✅ Pass
All four filters confirmed across multiple independent sources. 1 2 3
PEG derivation: Forward PEG = Finviz Forward P/E of 11.28 ÷ 5-year EPS growth estimate of 36.25% = 0.31. Trailing PEG = StockAnalysis Trailing P/E of 29.70 ÷ 36.25% = 0.82. Both sit well below 1.0. StockAnalysis and Yahoo Finance display PEG as n/a — standard for mining companies whose GAAP EPS is highly sensitive to commodity prices; Finviz is the sole source for this figure. 3 1
TTM revenue construction: Q1'26 ($39.43M) + Q4'25 ($30.54M) + Q3'25 ($21.04M) + Q2'25 ($21.81M) = $112.82M. Prior-year TTM (Q1'25 through Q2'24): $18.84M + $24.38M + $14.62M + $14.79M = $72.63M. Growth = 55.33%, within rounding of StockAnalysis's 55.36%. 4
Loading stats card…

Business model

Avino Silver & Gold Mines Ltd (founded 1968, headquartered in Vancouver, Canada) operates three 100%-owned assets inside Mexico's Durango state Silver Trend — all within roughly 20 kilometers of each other. 5
Avino Mine is the company's sole producing asset. It runs underground with a 2,500 tpd milling circuit and produced 1,157,828 oz silver, 7,621 oz gold, and 5,667,996 lbs copper in FY2025 — totaling 2,606,155 AgEq oz (silver equivalent ounces, a standard blended metric that converts gold and copper output into silver oz using prevailing price ratios) against a 2.5–2.8M AgEq oz guidance range. 6 In Q1 2026, 60% of revenue came from silver at a realized price of $86.42/oz. 7 Copper is a meaningful byproduct; the silver–gold–copper mix buffers cash flow when any single metal lags.
La Preciosa Mine is the growth engine. Acquired in Q1 2022 and 100%-owned since Q3 2025 (after buying out Deterra Royalties for $13.25M cash plus $8.75M deferred consideration), La Preciosa processed 11,995 tonnes of development ore in 2025 and delivered 48,244 oz silver before any commercial production was declared. 8 The 2026 target: 500 tpd by H2 2026. 6 Management also switched the mining method from narrow-vein shrinkage stoping to wider-vein longhole sub-level caving after discovering that the orebody is broader than the original resource model estimated — a method change that, if confirmed, lowers per-tonne costs and increases throughput rate.
Oxide Tailings Project has completed its preliminary feasibility study. It represents a third potential production source with no additional mining required, though no commercial production timeline has been set.
Avino, La Preciosa, and the Oxide Tailings Project plotted within Durango&#39;s Silver Trend
All three Avino assets sit within the Durango Silver Trend. 5
Reserves and resources (as of October 31, 2025): The April 2026 inaugural consolidated reserve announcement quantified 127M AgEq oz in proven + probable reserves across 27M tonnes at 145 g/t, with M&I resources of 301M AgEq oz (67.7M tonnes at 162 g/t) and an additional 87.6M AgEq oz inferred. 9 CEO David Wolfin described it as the first public demonstration of "the underlying quality, scale, and economic potential of our asset base." 9 The 42% resource-to-reserve conversion ratio is in line with peers; the reserve base supports decades of production at current throughput rates.
2026 production guidance: 1.0–1.2M oz silver, 5–7k oz gold, 6–7.5M lbs copper, 2.4–2.7M AgEq oz. AISC guidance $25–27/AgEq oz (vs FY2025 actual $23.75). Capital budget $20–26M, of which $13–15M is growth capital directed at La Preciosa. 6

Financials and growth

Revenue: eight consecutive quarters of YoY gains

QuarterRevenueYoY growth
Q2'24$14.79M+60.4%
Q3'24$14.62M+18.7%
Q4'24$24.38M+94.6%
Q1'25$18.84M+52.0%
Q2'25$21.81M+47.5%
Q3'25$21.04M+44.0%
Q4'25$30.54M+25.3%
Q1'26$39.43M+109.4%
Source: 4
The growth is commodity-price-driven, not volume-driven. Silver spot averaged roughly $27–29/oz in Q2–Q3 2024, climbed to the mid-$30s range in Q4 2024, and surged to $50–85/oz range through 2025 into Q1 2026 (touching $100/oz in January 2026 for the first time since 1979). 10 Throughput grew more modestly: FY2025 milled tonnes were up 14% YoY, and Q1 2026 milled tonnes were up 11% YoY. That volume growth matters — it means ASM is capturing the higher prices with more ore, not running in place.
Loading chart…

Earnings: margin expansion tracks the revenue climb

QuarterNet incomeEPS (diluted)Gross margin
Q2'24$1.24M$0.0131.8%
Q3'24$1.17M$0.0139.1%
Q4'24$5.09M$0.0342.9%
Q1'25$5.62M$0.0456.1%
Q2'25$2.86M$0.0246.9%
Q3'25$7.70M$0.0547.1%
Q4'25$10.46M$0.0658.4%
Q1'26$15.91M$0.0959.4%
Source: 4
TTM net income totals $36.94M (32.74% net margin) and TTM EBITDA margin is 47.86%. 1 The gross margin trajectory — from 31.8% in Q2 2024 to 59.4% in Q1 2026 — reflects the operating leverage miners enjoy when commodity prices outrun relatively fixed production costs. FY2025 AISC of $23.75/AgEq oz against a Q1 2026 realized silver price of $86.42/oz delivers a margin per oz that would have seemed implausible eighteen months ago. 7
Analyst consensus for FY2026 EPS is $0.48 and FY2027 is $0.81, implying a 5-year EPS CAGR of 36.25%. 11 FY2026 revenue consensus is $217.3M (+73.6% vs FY2025's $92.2M), largely reflecting a full year at elevated silver prices plus La Preciosa contributions in H2. 11
One dilution note: diluted share count rose from ~139M in Q2 2024 to ~174M in Q1 2026 (+25.2%), driven by the ATM equity program (At-The-Market — a facility allowing the company to sell newly issued shares into the open market at prevailing prices without a traditional underwritten offering) and base shelf prospectus. 12 The NCIB announced April 6, 2026 authorizes buyback of up to 8,428,566 shares (~5% of float) over twelve months and is intended to partially offset future dilution. 13

Valuation

ASM vs. primary silver mining peers

CompanyTrailing P/EForward P/EEV/EBITDAP/SNet margin
ASM (Avino)29.73×16.92×18.80×9.52×32.7%
HL (Hecla Mining)23.13×20.33×12.05×6.52×16.8%
PAAS (Pan American Silver)15.46×11.06×9.02×4.86×31.7%
CDE (Coeur Mining)14.12×8.95×13.70×4.50×31.2%
Sources: 2 14 15 16
ASM trades at a premium on every multiple. That premium needs unpacking. On trailing P/E (29.73× vs. HL's 23.13×, PAAS's 15.46×, CDE's 14.12×), ASM looks expensive — but it also carries a net margin of 32.74%, roughly double Hecla's 16.8%. On EV/EBITDA, the gap is wider (18.80× vs. 9.02–13.70× for peers), though ASM's EBITDA margin of 47.86% TTM runs significantly above Hecla's and Coeur's. The forward P/E of 16.92× (StockAnalysis) or 11.28× (Finviz, using a higher EPS estimate) is more defensible: at 16.92× against a 36.25% five-year EPS CAGR, ASM's forward PEG of 0.47 (16.92 ÷ 36.25) sits in value territory even on the more conservative forward earnings assumption.
The clearest fundamental justification for the premium: ASM has zero financial debt and $130M in net cash. Hecla carries $1.7B in total debt; Coeur carries $0.7B; Pan American carries $1.4B. A debt-free mining company with a 32.7% net margin and an undeveloped asset poised to double output within 18 months deserves a multiple above the levered-up peer group.
FCF yield of 1.14% TTM (FCF $12.72M on $1.11B market cap) is thin because CapEx is elevated at $27.57M TTM — the La Preciosa buildout. Once La Preciosa reaches 500 tpd and CapEx normalizes, FCF should expand materially. 1 12

Balance sheet

MetricValueSource
Cash & equivalents$138.65MStockAnalysis 17
Total financial debt$8.34M (inc. $7.58M leases)StockAnalysis 17
Net cash$130.30M ($0.77–0.80/share)Calculated 17
Total assets$318.84MStockAnalysis 17
Shareholders' equity$275.39MStockAnalysis 17
D/E ratio0.03×StockAnalysis 1
Current ratio5.78×StockAnalysis 1
Quick ratio5.21×StockAnalysis 1
Interest coverage133–148×StockAnalysis, ROIC.ai 1
Altman Z-Score11.99–14.71StockAnalysis (11.99), ROIC.ai (14.71) 1
OCF (TTM)$40.30MStockAnalysis 12
FCF (TTM)$12.72MCalculated (OCF $40.30M – CapEx $27.57M) 12
ROE / ROA / ROIC18.12% / 12.48% / 23.04%StockAnalysis 1
On the Altman Z-Score: A reading of 11.99 (StockAnalysis) to 14.71 (ROIC.ai) — far above the 3.0 "safe zone" — is driven primarily by the market-value-of-equity–to–total-liabilities ratio. With a $1.10B market cap sitting atop just $43.45M in total liabilities ($8.34M financial + $35.11M operating), the MVE/TL ratio of ~25× contributes the bulk of the Z-Score. This is not a typical manufacturing Z-Score reading; it reflects a company that is effectively unlevered relative to its market value. What it tells a practical investor: there is no creditor-driven stress scenario, no refinancing cliff, and no covenant exposure in this stock. 1
The cash build is itself notable. FY2025 year-end cash was $102M — a 272% YoY increase. 18 As of Q1 2026, cash stands at $138.65M. The Q1 2026 financing cash inflow of $102.69M (via ATM equity) inflated the number; strip that out, and the underlying organic cash generation was OCF $40.30M minus CapEx $27.57M = $12.72M for the TTM. The equity raises are funding La Preciosa growth capital, not covering operating losses.

Growth catalysts

1. La Preciosa ramp to 500 tpd (H2 2026). This is the primary catalyst. As of Q1 2026, La Preciosa contributed 49,830 oz silver from development ore and the mill circuit had already been switched. 19 The H2 2026 500 tpd target — expanding eventually toward the long-term plan of 5,000 tpd — would add a second production source to the income statement in the second half of the year. Because La Preciosa's ore grades (191 g/t silver in 2025 development ore) are high, even modest throughput delivers meaningful silver ounces. Management confirmed: "production will be weighted to the second half of 2026, and we remain on track with our forecasted production for the year." 19
2. 30,000-meter 2026 drill program. Avino is running four drill rigs simultaneously across Avino Mine (15,000m) and La Preciosa (15,000m) this year. 6 Q1 completed 5,600 meters. January 2026 drilling at La Preciosa delivered high-grade intercepts above the current resource-average grade, consistent with resource expansion potential. The company is also integrating AI data analysis across its geological dataset to accelerate resource-to-reserve conversion. A resource update in H2 2026 could quantify upside beyond the current 301M AgEq oz M&I figure.
3. Silver market structural deficit. The Silver Institute and Metals Focus forecast a 67 million oz deficit in 2026 — the sixth consecutive annual deficit. 10 Physical investment demand is up 20% to 227M oz (a three-year high). London silver market physical liquidity has been intermittently tight. ASM's FY2026 revenue consensus of $217.3M assumes no dramatic price recovery — it is modeled at silver prices below the $86.42/oz Q1 2026 realized level. If silver stabilizes above $65/oz, the math closes comfortably.
4. Senior management upgrade. June 8, 2026: Marc Turcotte joined as SVP Corporate Development. 20 Turcotte spent more than a decade as Chief Development Officer at MAG Silver and was part of the team that sold MAG to Pan American Silver for $2.1B. His hire, combined with a concurrent ATM renewal, signals that Avino is actively scanning for M&A and strategic transactions. Peter Latta's simultaneous promotion to SVP Technical Services added a second senior technical voice. Whether this results in a transaction in the next 12 months is speculative; the hire itself is a credible optionality signal. 20
5. NCIB buyback. The April 6, 2026 NCIB (Normal Course Issuer Bid — the Canadian regulatory framework for share buyback programs) authorizes repurchase of up to 8,428,566 shares (~5% of float) through April 7, 2027. 13 At $6.54/share, buying back 5% of the float costs roughly $55M — well within ASM's $138M cash balance. CEO Wolfin said at current silver prices ASM "expects to generate enough free cash flow in 2026 to support the repurchase." The buyback provides EPS accretion and partial dilution offset from the ATM.

Key risks

Risk #1 — Silver price is the dominant variable. ASM does not hedge production. Every $10/oz move in silver changes annual revenue by roughly $10–12M at current production rates (~1.2M oz/year silver). 7 Silver fell from $100/oz (January 2026) to roughly $65–70/oz by June 2026 — a 35% drawdown that partly explains why ASM is sitting 45% below its 52-week high of $11.99 despite record Q1 earnings. With a 5-year beta of 2.89 (Yahoo Finance, StockAnalysis), 2 1 ASM amplifies every broad market move by roughly 3×. Trigger to watch: silver spot below $55/oz would compress margins meaningfully — at FY2025 AISC of $23.75/AgEq oz, there is still positive cash margin, but the cushion narrows sharply.
Risk #2 — Dilution is ongoing and structural. Share count grew 13.26% YoY (from ~149M to ~169M), and the ATM equity program was renewed June 8, 2026. 20 The company is funding La Preciosa growth capital partly through stock issuance. The NCIB (5% maximum buyback) cannot fully offset ATM-pace dilution if La Preciosa development spending remains elevated. Investors should track diluted share count quarterly as a direct drag on per-share metrics.
Risk #3 — Mexico single-district concentration. All three assets sit within a 20-kilometer radius in Durango state. A single natural disaster, labor disruption, or regulatory action affecting the district could halt all production simultaneously. Mexico's 2024 mining law amendments introduced regulatory uncertainty across the sector — the Camimex mining industry association warned the reforms threatened $9B in investment. 21 ASM has operated in Durango since 1968 with three consecutive ESR (Empresa Socialmente Responsable) certifications and a 100% Mexican direct workforce, which reduces community-conflict risk compared to multinational operators, but federal regulatory risk is not company-specific.
Risk #4 — La Preciosa execution. The mining method switch from shrinkage stoping to longhole sub-level caving is intended to improve economics, but method changes introduce grade dilution, geomechanical risk, and schedule uncertainty. The 500 tpd H2 2026 target is management guidance, not a contractual commitment. Ramp delays push the production contribution to 2027 and defer the FCF inflection.
Risk #5 — AISC creep. FY2025 AISC was $23.75/AgEq oz; 2026 guidance is $25–27/AgEq oz, a 5–14% increase. The guidance range reflects La Preciosa's higher per-tonne development costs ($105–120/tonne operating cost vs. Avino Mine's $55–65/tonne). 6 If silver prices compress and La Preciosa cost overruns push AISC above $30/AgEq oz, free cash flow turns negative and the buyback program becomes untenable.

Price action

MetricValueSource
Price (Jun 18, 2026 close)$6.54Finviz 3
52-week high$11.99Finviz 3
Distance from 52-week high–45.5%Calculated
52-week low$3.10Finviz 3
YTD performance+5.3%Finviz 3
1-year performance+85.3%Finviz 3
3-year performance+860.4%Finviz 3
50-day moving average$6.84 (price below)Finviz 3
200-day moving average$6.50 (price above)Finviz 3
RSI (14-day)48.55Finviz 3
Beta (5-year)2.89Yahoo Finance, StockAnalysis 2
Average daily volume4.04M–4.94M sharesMultiple sources 3
Short float2.81–3.03%Yahoo Finance, Finviz 2
Days to cover0.97–1.08Yahoo Finance, Finviz 2
The 45% decline from $11.99 to $6.54 is silver's fault, not ASM's. Q1 2026 delivered record revenue (+109% YoY), record net income ($15.91M), and record EBITDA ($25.5M) — all in the same quarter the stock was more than halving from its high. 7 RSI of 48.55 sits in neutral territory, not oversold. Short float at 3% with under 1.1 days to cover is effectively minimal — there is no short-squeeze setup and no short-seller thesis of consequence in the market today. The stock is hugging its 200-day MA ($6.50), 0.6% above it as of the June 18 close. 3
Short interest did jump roughly 40% from April 30 to May 29 (from 3.42M to 4.80M shares). 2 At this scale it does not read as a bear raid; more likely sector rotation or hedging as silver pulled back from its January highs.

Analyst consensus

FirmActionPrice target
Roth CapitalTarget raised $7.50 → $8.00 (May 14, 2026)$8.00
Additional coverage (2 more analysts)Avg. $11.31
Sources: 11 3
Four analysts cover ASM with a consensus rating of Buy (1.50/5.00). Average price target is $11.31, implying 72.9% upside from the $6.54 June 18 close. 1 The range is wide: Roth Capital's $8.00 is the most conservative; the high target implied by Yahoo's analysis distribution is ~$13.63. 11
One flag worth tracking: Roth Capital downgraded ASM from Buy to Neutral in July 2025 with a $3.50 target — at a time when the stock was trading around $3.50. Since then, the stock has risen 87% to $6.54. The May 2026 target raise to $8.00 brings Roth back toward consensus but it remains the most bearish of the four. 3

Insider and institutional ownership

MetricValueSource
Insider ownership6.37–6.86%StockAnalysis, Finviz, Yahoo 1
Institutional ownership23–30%StockAnalysis (23.09%), Yahoo (29.95%), Finviz (28.27%) 1
Recent insider transactions0.00% (Finviz net)Finviz 3
Top 5 institutional holders (as of March 31 / May 31, 2026): Tidal Investments LLC 6.66M shares (3.91%); Amplify Junior Silver Miners ETF 6.61M shares (3.88%); Mirae Asset Global ETFs 6.22M shares (3.65%); Van Eck Associates 5.01M shares (2.94%); Global X Silver Miners ETF 4.85M shares (2.85%). 22
Insider ownership at ~6.4% (CEO David Wolfin and team) with no disclosed open-market sales is a notable contrast to last week's Pass #28 (HNI), where insiders were sellers. The Finviz net insider transaction figure of 0.00% reflects no open-market purchases or sales in the recent tracking period — neither a positive nor a negative signal, but at minimum management is not distributing shares. The 193 institutional holders include four silver-specific ETFs in the top ten, meaning ASM's institutional base is naturally aligned with silver as an asset class rather than broad equity mandates. 22

Upcoming catalysts

EventExpected timing
Q2 2026 production resultsLate July 2026 — first data on La Preciosa 500 tpd ramp progress
Q2 2026 earnings~August 12, 2026 (Zacks consensus EPS $0.09; 2 analysts revenue est. $57.76M)
La Preciosa H2 2026 500 tpd targetH2 2026 (company guidance)
Possible resource updateH2 2026 (post-30,000m drill program)
H.C. Wainwright Global Investment ConferenceSeptember 14–16, 2026
Beaver Creek Precious Metals SummitSeptember 22–25 (David Wolfin presenting September 23)
New Orleans Investment ConferenceOctober 28–31, 2026
NCIB buyback windowApril 8, 2026 – April 7, 2027
Sources: 11 3 23
The Q2 2026 production report in late July is the single most important near-term data point. Q1 2026 had La Preciosa contributing 49,830 oz silver from development-phase ore. Q2 should show whether the Mill Circuit 2 ramp toward 500 tpd is on track. The two-analyst Q2 revenue consensus of $57.76M compares with Q2 2025's $21.81M — implying +165% YoY growth — and Q1 2026's $39.43M. That acceleration is achievable only if silver holds near current prices ($65+/oz) and La Preciosa adds incremental ounces. 11

Pass/fail summary

ASM passes all four hard filters with dual-source confirmation: market cap $1.10–$1.15B ✅, TTM revenue growth 55.3% ✅, PEG 0.31 forward / 0.82 trailing ✅, OCF +$40.30M ✅.
Where ASM stands apart in the 29-pick series: it is the only silver miner with a net-cash balance sheet and a concurrent production growth story. Net cash of $130M, D/E of 0.03, interest coverage of 133×, Altman Z-Score of 11.99 — these are metrics that do not normally appear in the same sentence as a company running a 55% revenue growth rate. The clean balance sheet means the La Preciosa ramp is funded from cash, not creditors. If the ramp executes, ASM's H2 2026 production is weighted toward higher output; if silver prices compress further, the company can still service operations at zero financial stress.
What requires scrutiny before acting: the 55% TTM revenue growth is almost entirely commodity-price-driven — throughput grew 11–14%, but silver moving from $27/oz to $86/oz is doing the heavy lifting. The stock is 45% below its 52-week high because silver is 35% below its January 2026 peak. The 5-year beta of 2.89 is not a metaphor — ASM will outperform in a silver bull move and underperform sharply in a reversal. Share dilution of 13.26% YoY from the ATM program is an ongoing cost that the NCIB can only partially offset. And La Preciosa's 500 tpd H2 2026 target is a management estimate, not a guaranteed milestone.
The screen found a rare combination: a profitable, debt-free silver producer with a second mine in production ramp and a 73% analyst price target upside at $6.54. The question a prospective buyer needs to answer is whether the current silver price ($67/oz as of Q2) is a floor or a new ceiling — because that answer determines whether the Q2 2026 earnings report is a catalyst or a confirmation of the drawdown.
For informational purposes only; not investment advice. All data from publicly available sources as of June 18–19, 2026. Pass #29 of the daily US small-cap screen (market cap < $10B, TTM revenue growth > 30%, PEG < 1, positive operating cash flow). Previously featured: HNI, EE, CMBT, KNSA, GRND, BWAY, BKV, AG, VIST, AUB, CARE, BLLN, ATAT, ABX, PLMR, GPOR, HALO, DLO, TREE, MXL, PAY, KVYO, DAVE, ASIC, FIGR, ZETA, FLYW, ANIP.
封面图:图片来自 Avino Silver & Gold Mines Ltd

Add more perspectives or context around this Post.

  • Sign in to comment.